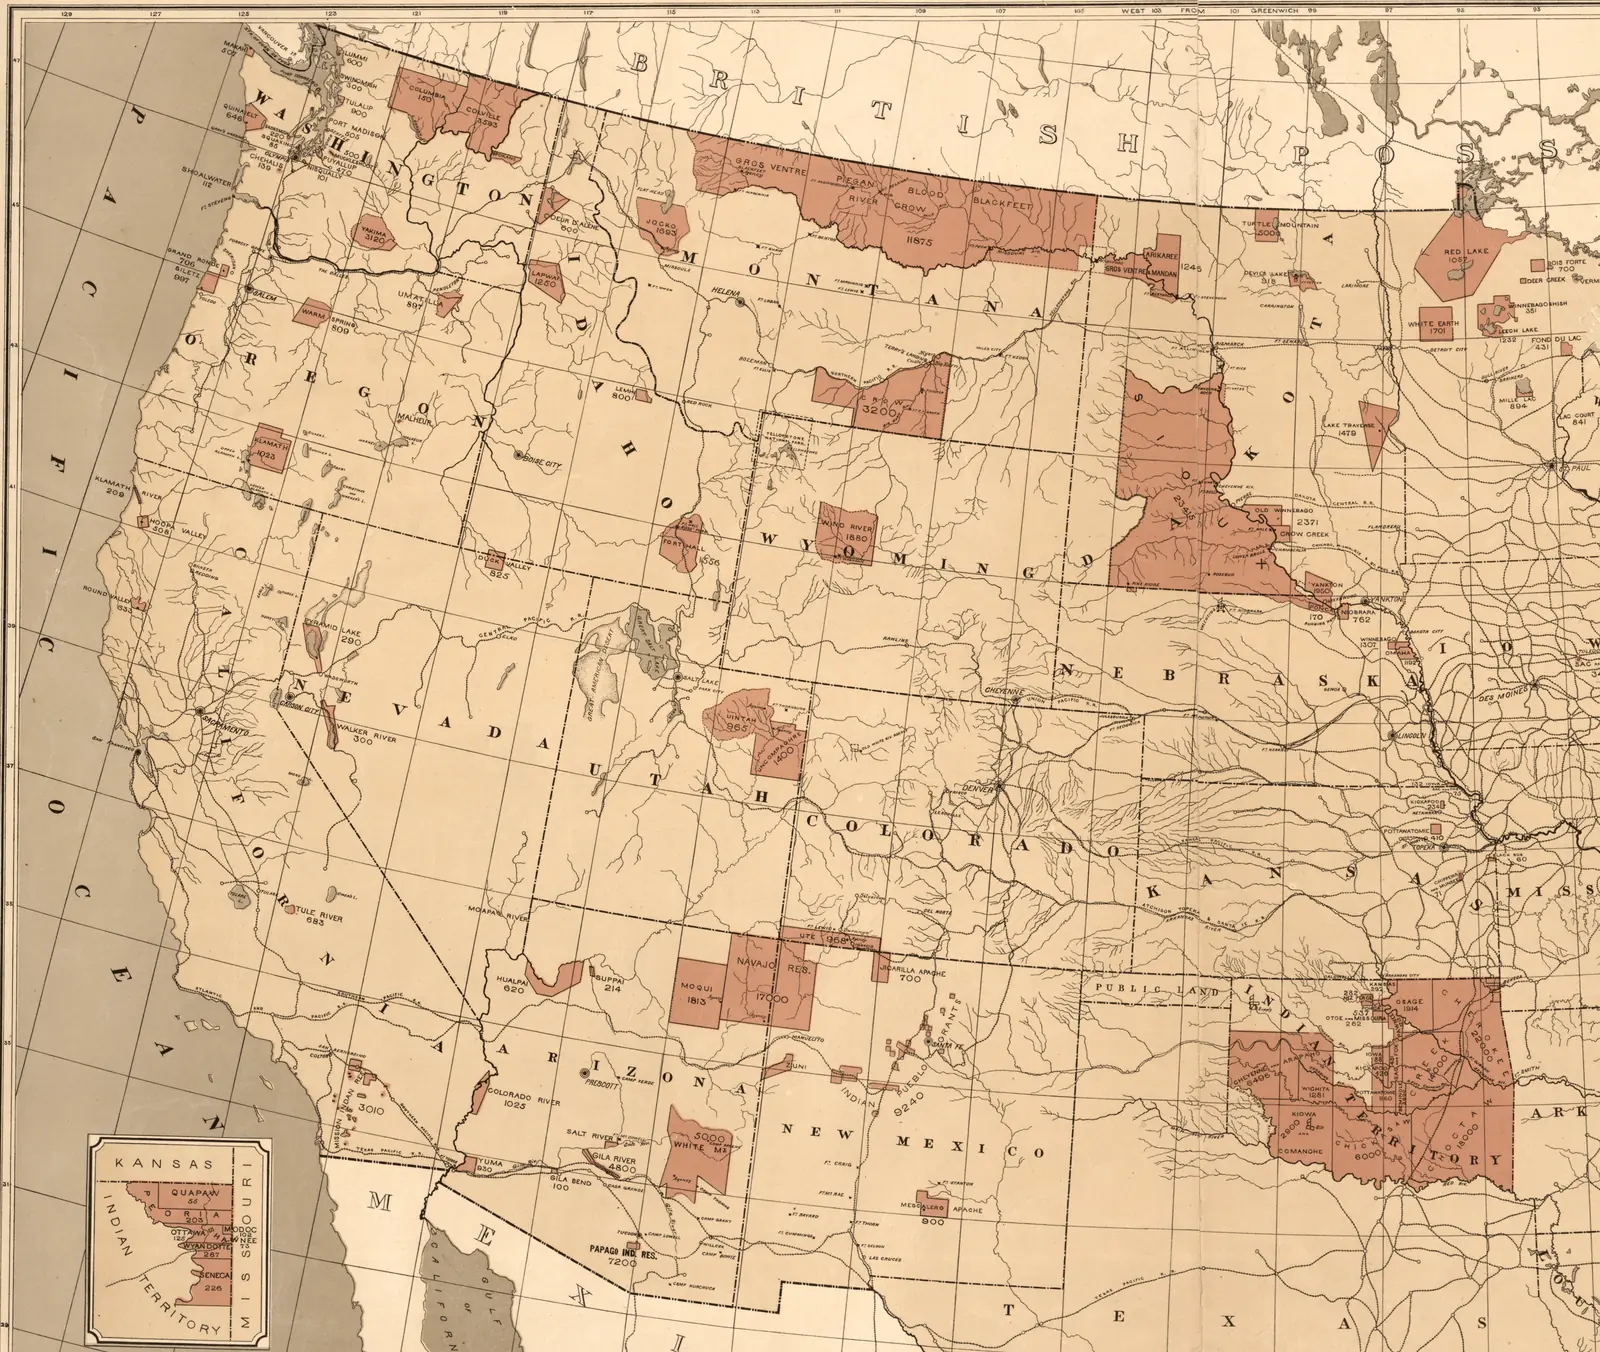
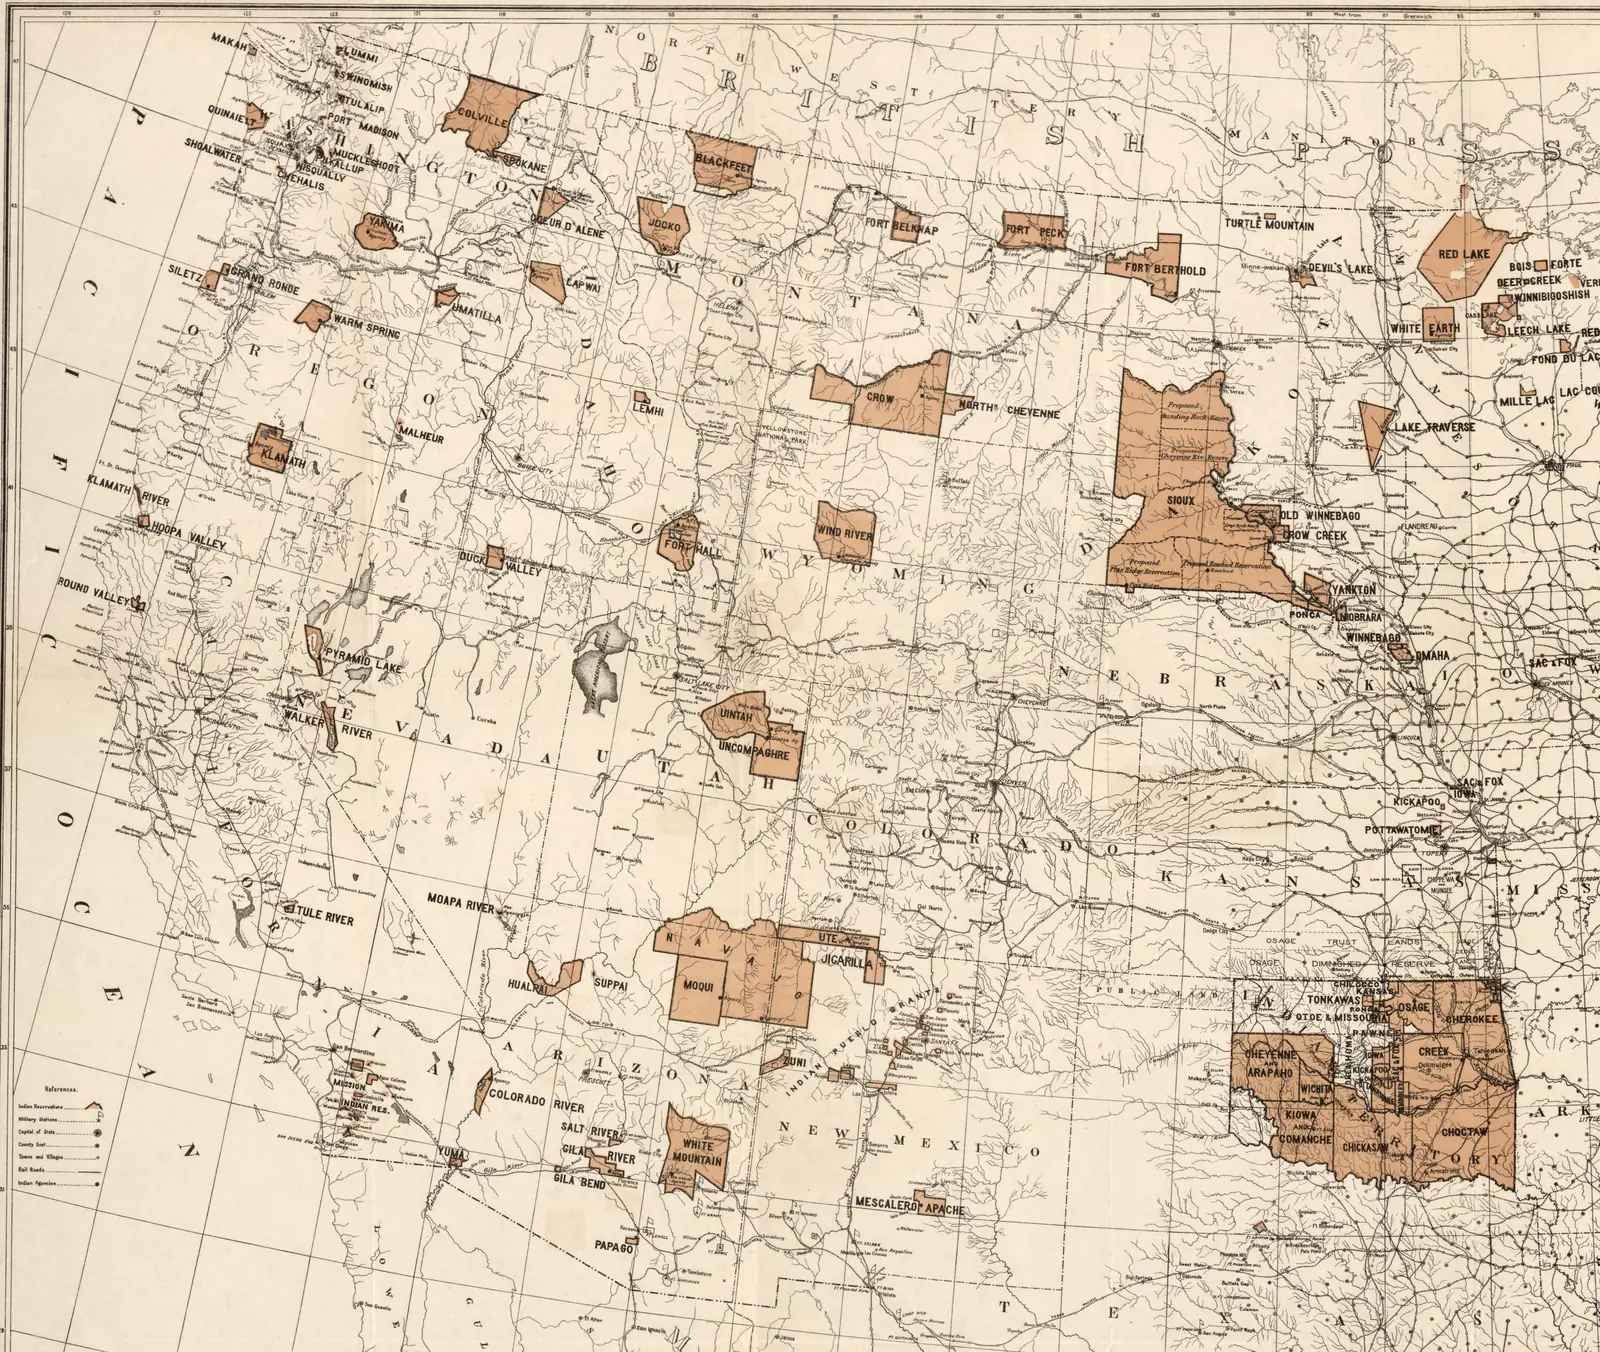
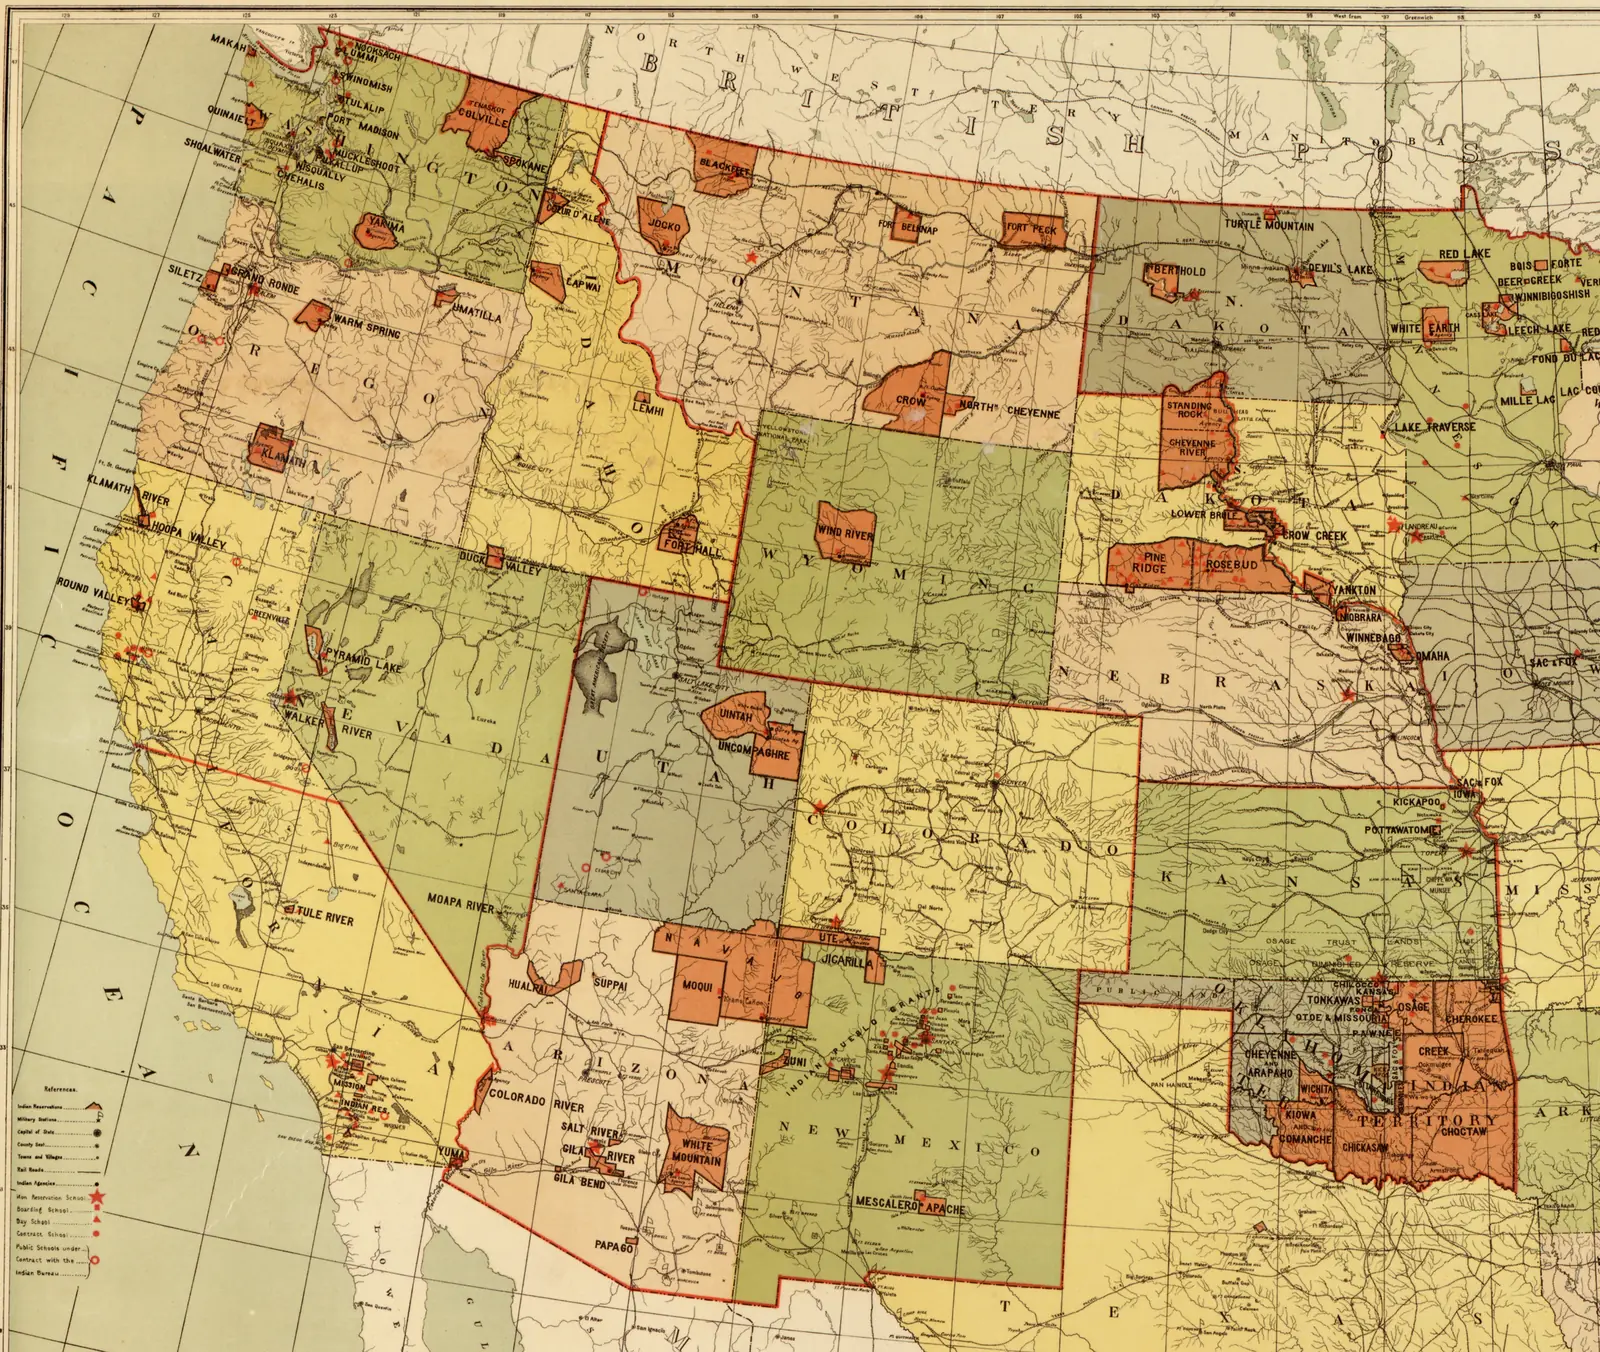
The government's reservation maps begin late. By 1883 most of the West had already been taken; the coloured blocks are what was left, on paper, to the peoples who had lived there. So the first map shows what came before, and the next two show the West in the 1870s, when Wovoka was a boy in Mason Valley.
Before
The land each people held
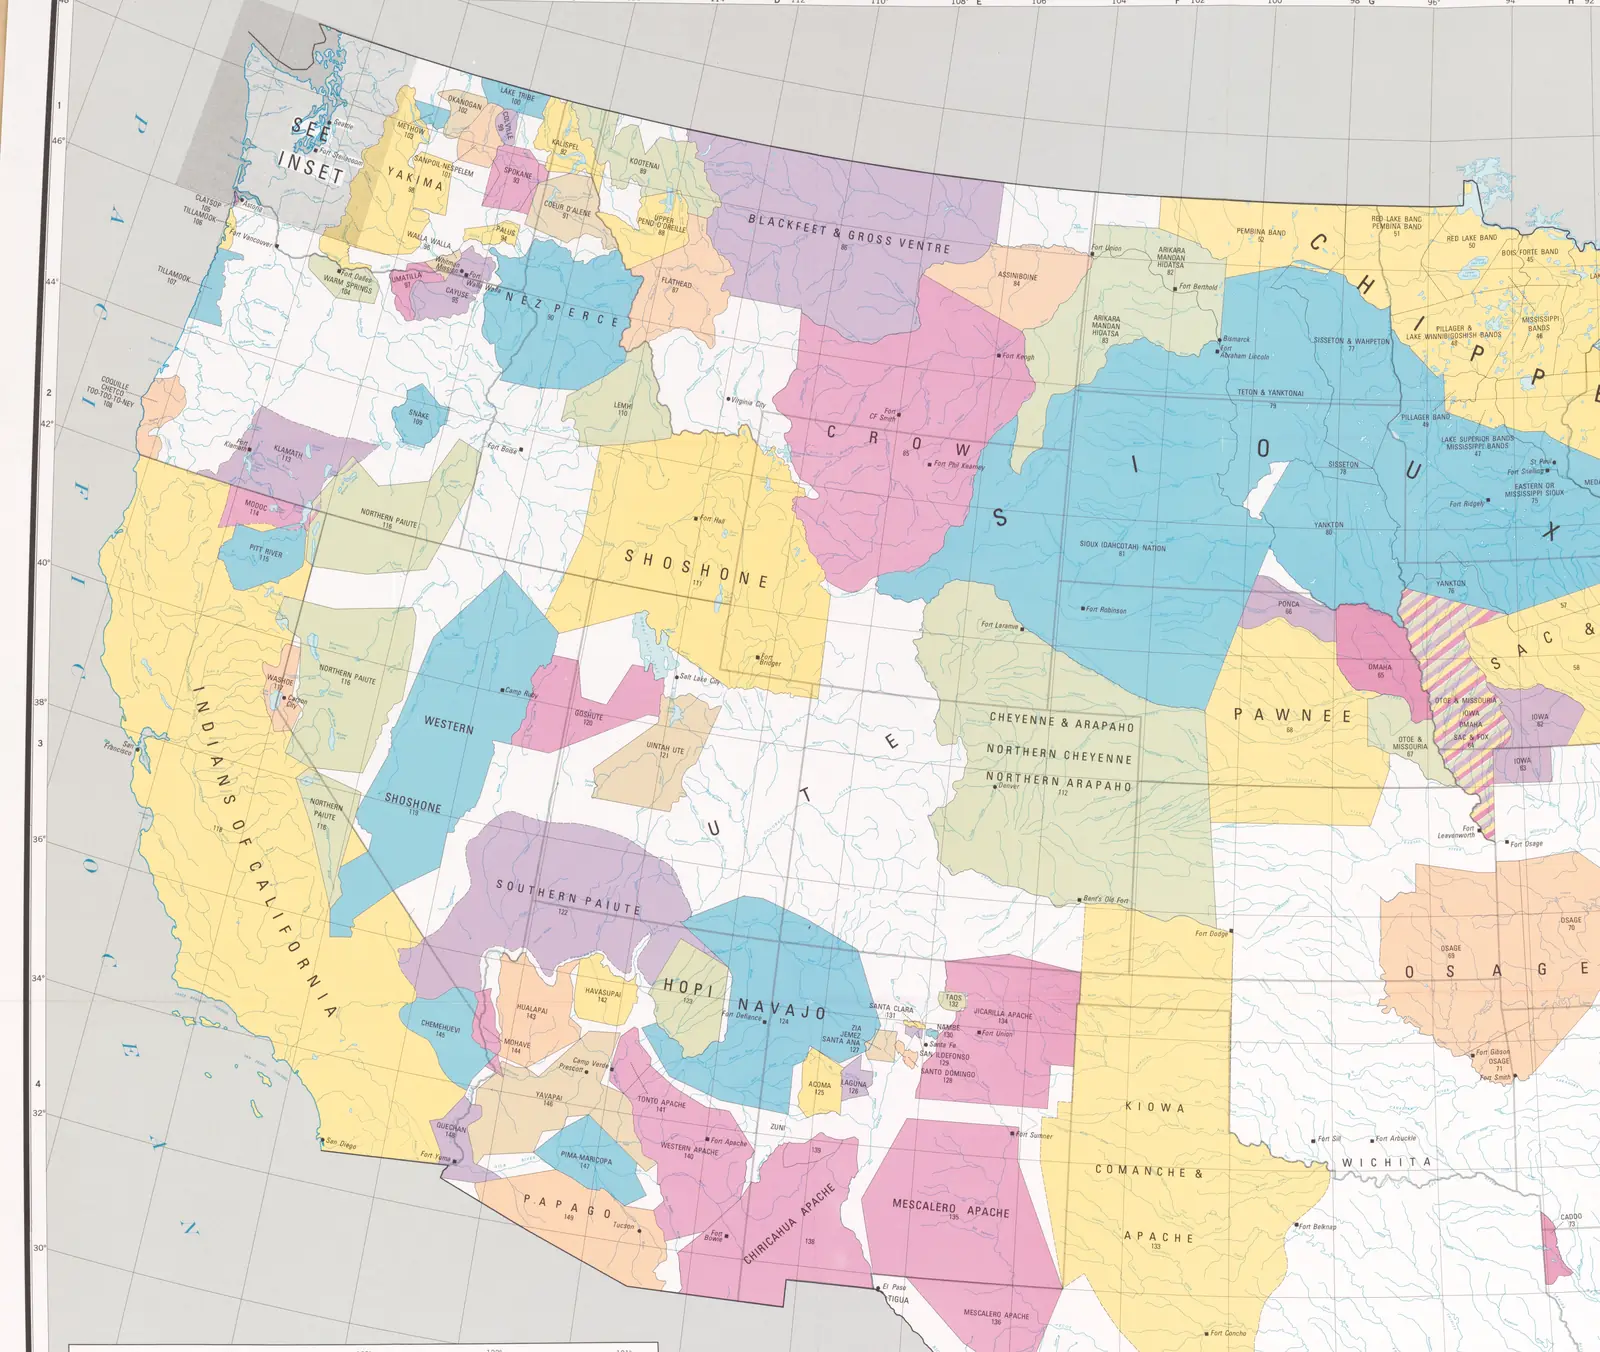
The first map is not from the nineteenth century. Tribes brought claims against the United States before the Indian Claims Commission and the Court of Claims, and in those cases a tribe could prove which land it had originally occupied. In 1978 the US Geological Survey drew every tract proved that way on one map of the country, as part of the Commission's final report. Almost the whole West is coloured.
It is the government's map too, and it has gaps. White land is not empty land. The map itself says that peoples whose names stand outside a coloured tract did not receive an adjudication of their original occupancy area
. Where two neighbouring tracts share a colour the peoples were related; otherwise the colours mean nothing. Western Washington is drawn on a separate inset of the original, so that corner shows grey here.
Move the slider from this map to 1883 and you see, all at once, what had gone before the reservation maps begin.
Source: Indian land areas judicially established, 1978, and the 1883 Office of Indian Affairs map.
1870
Counting the settlers
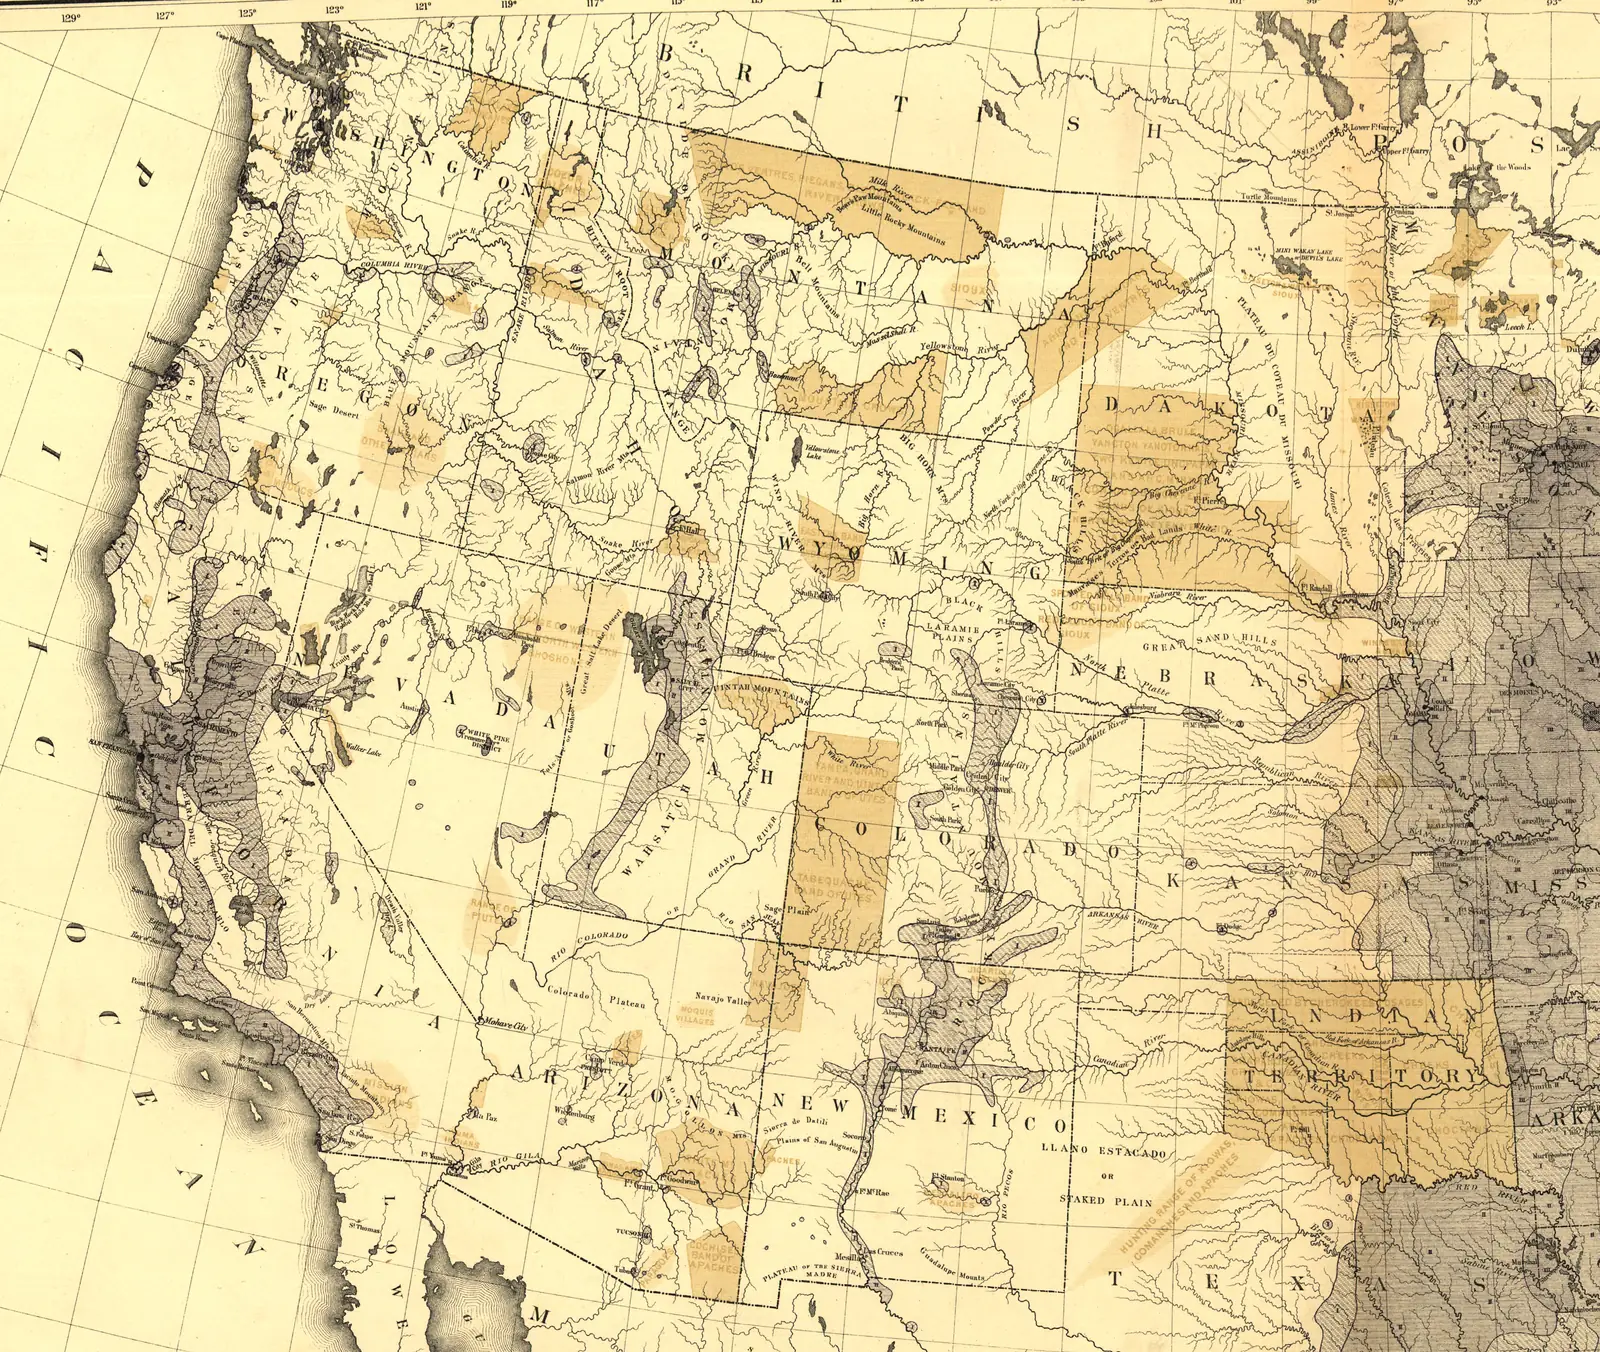
The second map comes from the census of 1870. Francis A. Walker drew the country in shades of grey for how many people lived on each square mile. His count left out Indians not taxed
, the peoples living in their own nations, so on this map they are not population at all. He showed them another way: a sketch of the principal reservations, and of the ranges or hunting grounds, from what the Office of Indian Affairs told him in 1871.
Most of the West is still pale on this map. The grey gathers on the Pacific coast, around Salt Lake, along the mountains of Colorado and New Mexico, and on the edge of the prairie states. In Dakota the Great Sioux Reservation runs west to the Wyoming line, with the Black Hills inside it. Slide on and watch the Hills: by 1883 they have been cut out.
The treaty of 1868 had set the Hills apart for the Sioux. An army expedition confirmed gold there in 1874, and an act of Congress in 1877 took them, with the land around them, well over seven million acres. A century later the courts found that the land had been taken and had to be paid for. A more ripe and rank case of dishonorable dealings will never, in all probability, be found in our history
, the Court of Claims wrote in 1975; the Supreme Court quoted those words in 1980, when it upheld the finding.
Sources: Walker, Statistical Atlas, 1874, plates XVIII–XIX · United States v. Sioux Nation, 1980, pp. 374–377, 382, 388 · the 1883 Office of Indian Affairs map
1876
The buffalo range
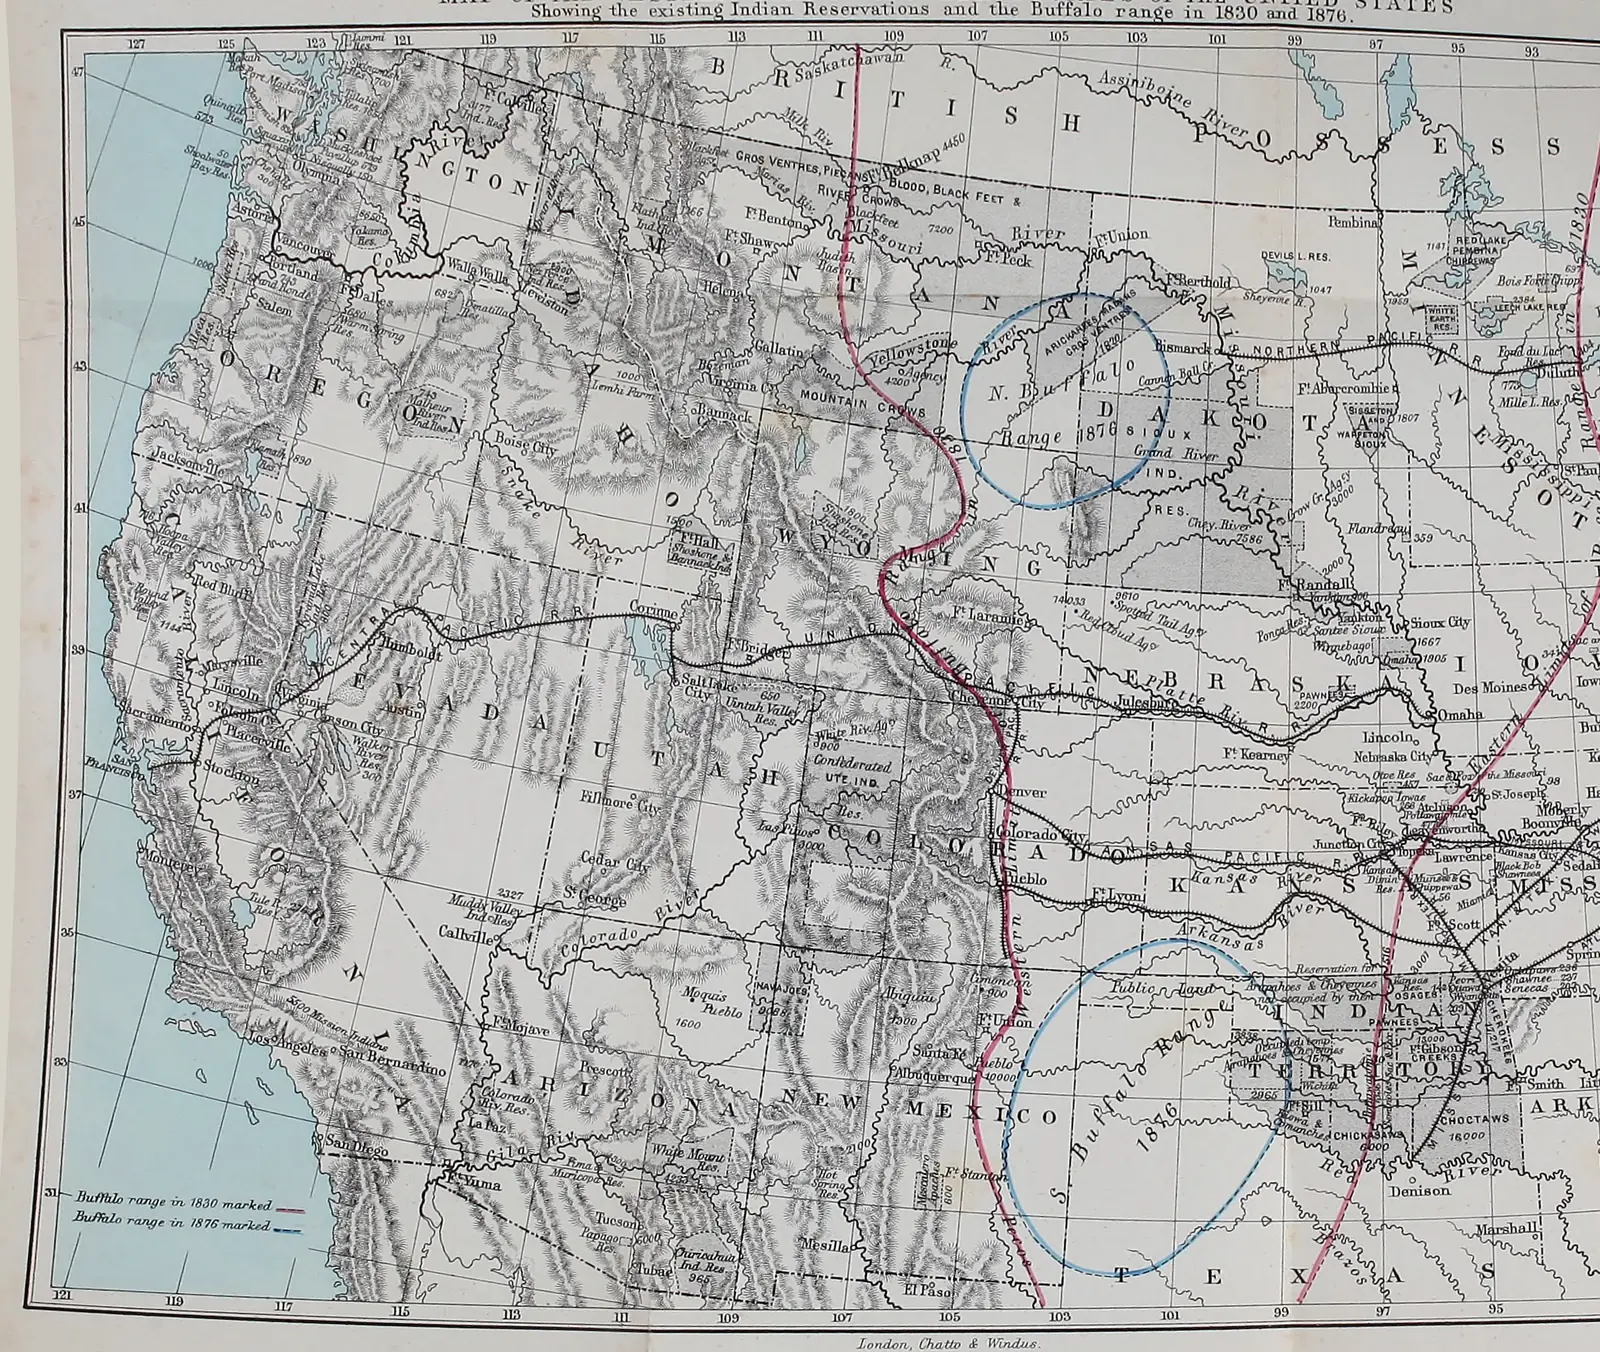
The third map is not the government's. It comes from a book by Richard Irving Dodge, an army officer who served on the plains, published in London in 1877 as The Hunting Grounds of the Great West. It shows the reservations of the time in grey. Over them it draws the buffalo. Two red lines mark the western and eastern limits of the buffalo range in 1830, with the whole of the plains between them. Two blue rings mark what was left in 1876: a northern range in western Dakota and eastern Montana, and a southern range in the Texas Panhandle and the west of Indian Territory.
The southern ring was where the last of a herd had run. By the close of the hunting season of 1875 the great southern herd had ceased to exist
, William Hornaday of the National Museum wrote in 1889; the survivors, about ten thousand, fled southwest into the Panhandle and the Staked Plain. The northern herd lasted a few years longer. The hunting season which began in October, 1882, and ended in February, 1883, finished the annihilation of the great northern herd.
Slide on to 1883, the year of the next map. How the herds were destroyed, and what the government did with the hunger that followed, is told on The buffalo and the ration.
Sources: Dodge 1877, map facing p. xv · Hornaday 1889, pp. 501, 511
Lakota country
One block becomes five
On the 1883 and 1888 maps the Great Sioux Reservation is one great block of land west of the Missouri River, set aside by the treaty of 1868. Look closely at the 1888 map and you can already see faint lines and the word Proposed
across it. That spring Congress had passed a law to cut the reservation into pieces and sell the rest, if three in four of the men agreed. That summer they turned the government's commissioners down.
In 1889 a second commission came, led by General George Crook, and this time it got enough signatures. About eleven million acres, half of what was left, were opened to settlers. On the 1892 map the block has become five separate reservations, Standing Rock, Cheyenne River, Lower Brule, Pine Ridge and Rosebud, with the land between them gone. The beef rations the commissioners had promised would not be touched were cut as soon as the signing was done. A year later, many of the people on those five reservations were dancing the Ghost Dance.
About that land … that we lost. We don't know what become of it, and I hope you will answer that question and tell me who was the man that sold that land. Whoever it was his glass was not very good—it was crooked.
Sources: the 1883, 1888 and 1892 Office of Indian Affairs maps · Pratt commission 1888, pp. 2–5 · Crook commission 1890, pp. 8, 15, 23–24, 222 · Mooney 1896, p. 826
Montana
The northern plains
In 1883 one reservation stretches across most of northern Montana, from the Rocky Mountains to Dakota. The map writes the names of the peoples who shared it across its width: Gros Ventre, Piegan, Blood, Blackfeet, River Crow.
On the 1888 map it is gone. In its place are three much smaller reservations strung along the Canadian border and the Missouri: Blackfeet, Fort Belknap and Fort Peck. Then look south to the Crow reservation on the Yellowstone River. On the 1892 map its whole western part has been cut away.
Source: the 1883, 1888 and 1892 Office of Indian Affairs maps.
Indian Territory
A territory renamed
Indian Territory, today's Oklahoma, is the largest block of reservation land on the 1883 and 1888 maps, nearly all of it coloured and divided among many nations: Cherokee, Creek, Choctaw, Chickasaw, Cheyenne and Arapaho, Kiowa and Comanche, and more.
By 1892 the western half is painted grey and lettered Oklahoma Territory
. The Cheyenne and Arapaho, Sac and Fox and Pottawatomie lands inside it are no longer coloured as reservations at all.
Source: the 1883, 1888 and 1892 Office of Indian Affairs maps.
Wovoka's Nevada
Where the lines did not move
Look at western Nevada, where Wovoka lived in Mason Valley, just west of the Walker River reservation. On the first map nearly all of it is one tract, Northern Paiute, the land the Commission found the Northern Paiute had held. On every map from 1870 on, two long, narrow reservations follow the rivers down to their lakes: Pyramid Lake in the north, Walker River in the south. Across these twenty-two years their lines hardly move.
That is not because nothing was taken. In Paiute country the land had gone earlier, to ranches and mines, and what went next was the water and the fish: a Nevada law of 1891 that stopped Pyramid Lake trout being shipped for half the year, a dam on the Truckee in 1905, the Walker River reservation opened to white settlers in 1906. None of that shows on a map of boundaries. Chapter 3 of his story tells it, and Whose land was this? shows what the government itself recorded for each piece of ground: for Mason Valley, no treaty at all.
Sources: Indian land areas judicially established, 1978 · Walker 1874 · Dodge 1877 · the 1883, 1888 and 1892 Office of Indian Affairs maps · Johnson 1975 · Knack and Stewart 1984
About these maps
The government's own record
Most of these are the government's maps, and they see what the government saw. They show the land it recognised as reserved, not the homelands it had already taken, and they use its names for peoples, which are not always the names the peoples used for themselves.
The homelands map is different: it was made in 1978 from court findings, long after the events, and it shows what the Commission accepted, not everything each people would say was theirs. It was drawn on a modern projection, so we lined it up with the old maps by hand, matching some forty towns, forts and state corners on each and fitting the two together; the fit is good to within a few miles.
The 1870 and 1876 maps were lined up the same way, from the lines of latitude and longitude, state corners and towns read on each. The census map fits to within about five kilometres. Dodge's map was made for a book, and less carefully; it fits to within about twenty kilometres, so read its lines as showing a region, not a valley.
The 1888 and 1892 maps were printed from the same base plate, so they line up almost perfectly. The 1883 map was drawn separately; we lined it up with the others by matching thousands of points where the rivers, coasts and borders are the same on both, and checked the fit by eye across the whole West. Each picture here is the western half of its map. Every original can be seen in full, at much higher resolution, at the Library of Congress.
| Edition | Title and maker | Original |
|---|---|---|
| Homelands, 1978 | Indian land areas judicially established. Prepared under the direction of the Indian Claims Commission; published by the US Geological Survey, Reston, Virginia, 1978. Scale 1:4,000,000. | Library of Congress. sha256 b1ec6d224c963b97b65c08d193d8f102877db48bdd92d3213b1be6e6482509a5 |
| 1870 | Map showing, in five degrees of density, the distribution, within the territory of the United States, of the constitutional population (i.e., excluding Indians not taxed) … to which is added a sketch of the principal Indian reservations and ranges from information furnished by the Office of Indian Affairs of date 1871. Francis A. Walker, from the ninth census. Plates XVIII–XIX of the Statistical Atlas of the United States, Julius Bien, lith., 1874. | Library of Congress, image ca000069. sha256 bc2244098739216a0066b6e220d1b90339daa3a1ed22581cfa3aa25c588ca7b8 |
| 1876 | Map of the western states and territories of the United States, showing the existing Indian reservations and the buffalo range in 1830 and 1876. Facing p. xv of Richard Irving Dodge, The Hunting Grounds of the Great West, London: Chatto & Windus, 1877 (the English edition of The Plains of the Great West). | Internet Archive, the Getty Research Institute's copy, leaf 24. sha256 a00d3b784ac29da93d69b46445a74b2b73c5fdb4bddffda6b6cb1954f8e18155 |
| 1883 | Map showing Indian reservations within the limits of the United States: 1883. Compiled under Commissioner Hiram Price; drawn by Paul Brodie. | Library of Congress. The Library's copy has a tear across the top middle. sha256 4f8af4f218ea231cf989276c4476b0440068beaf2ebb4d735a9f85c35ae70126 |
| 1888 | Map showing the location of the Indian reservations within the limits of the United States and territories. Office of Indian Affairs, under Commissioner John H. Oberly. | Library of Congress. sha256 aa588b7e4a3874e7f3270e22bd2eec3a0e10e635c804cc7f1c8f30bacc0fde1f |
| 1892 | Map showing Indian reservations within the limits of the United States. Office of Indian Affairs, under Commissioner Thomas J. Morgan. | Library of Congress. sha256 f16a5fdb0c467a160263b884da4cad3b4547519eab58ef4b1c4f75d8868a6e89 |
All but the 1876 map: Library of Congress, Geography and Map Division. US government works, public domain; the Library marks them free to use and reuse. The 1876 map was published in 1877 and is public domain. The checksums identify the exact files we started from.